Unlock Insights from Spatial Metabolomics Data
A powerful, user-friendly desktop application to bridge the gap between processed spatial data and publication-ready biological insights.
A Comprehensive Analysis Toolbox
Everything you need to go from raw numbers to interpretable results, no coding required.
Intuitive GUI
A step-by-step workflow guides you from data input to final analysis.
Advanced Preprocessing
Deep-learning powered tissue detection with full manual override.
Comprehensive Analyses
UMAP, t-SNE, Moran's I, LISA, Clustering, and more.
Interactive Results Viewer
Explore, customize, and save high-resolution, publication-ready plots.
Automated Reporting
Generate interactive HTML reports and flexible data exports (CSV, HDF5).
Reproducibility
Save and load your entire workflow setup for perfect reproducibility.
From Raw Data to Ready Insight
MetaboNexus transforms complex numerical data into clear, interpretable visualizations effortlessly.
Before: Raw Data Tables
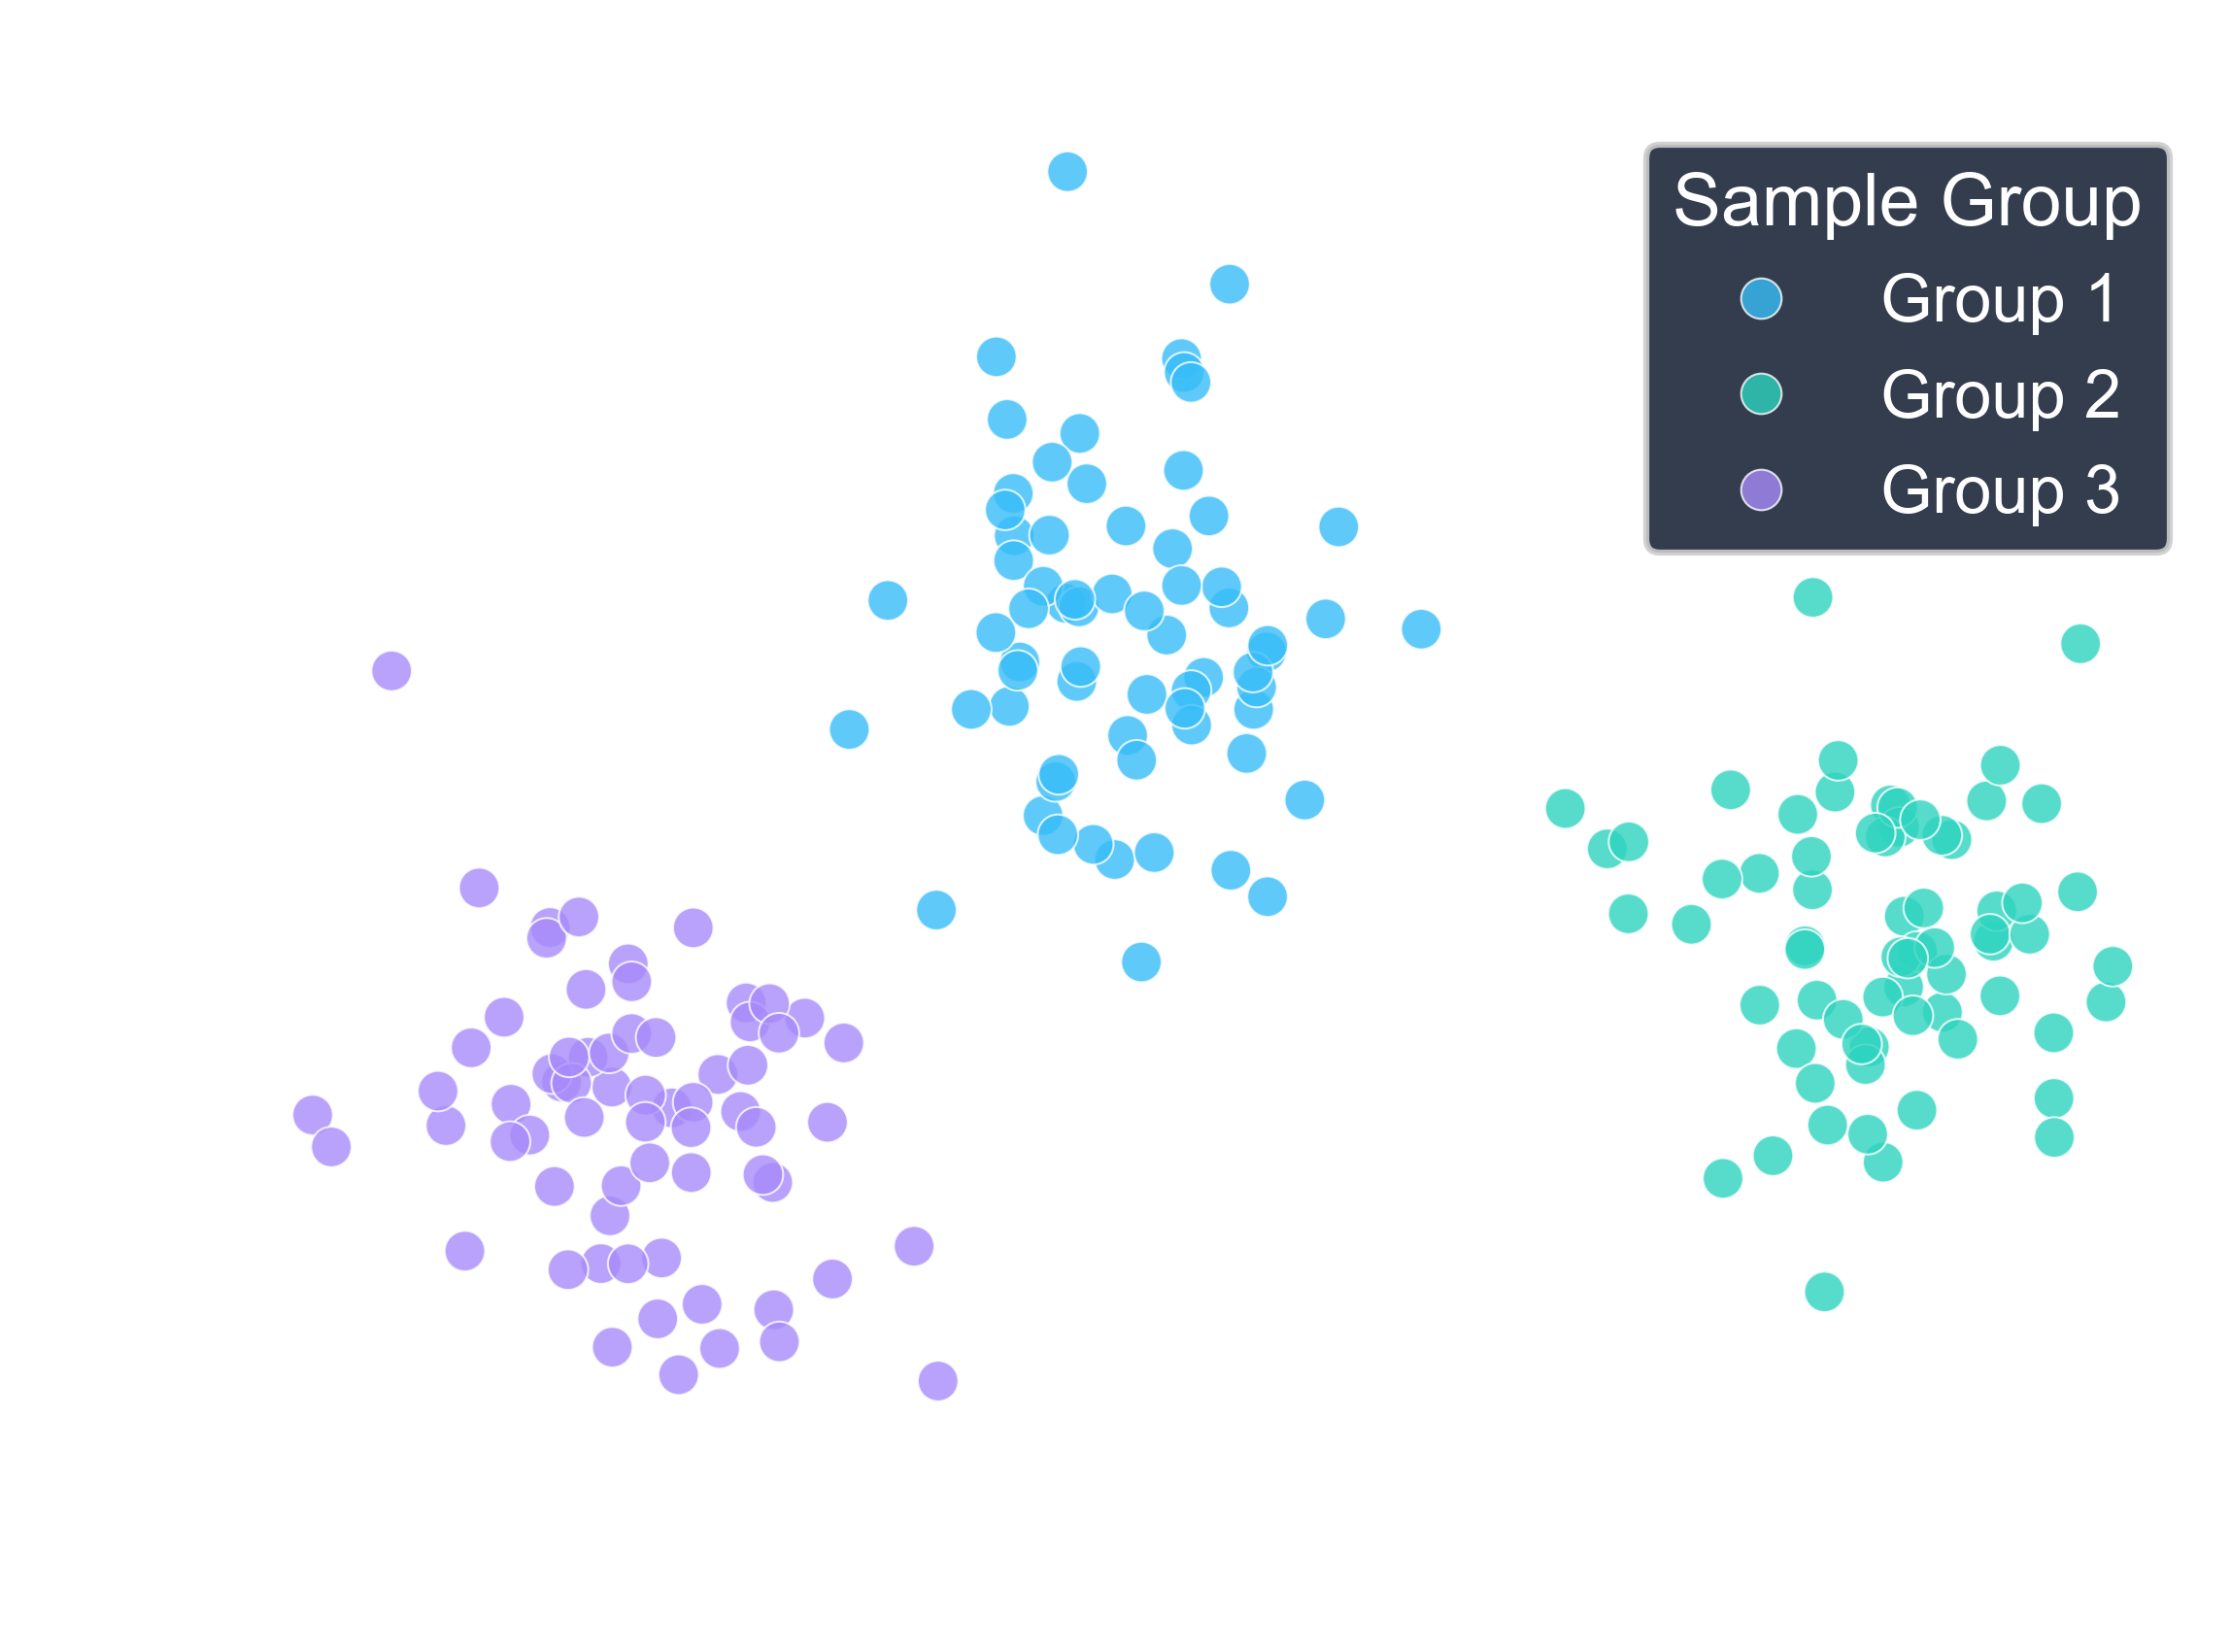
After: Publication-Ready Plot
Analysis Modules In Detail
Understand the powerful statistical methods at the core of MetaboNexus. Click to learn more.
Dimensionality Reduction
Visualize the high-level structure of your data with PCA, UMAP, and t-SNE to see how your samples cluster and relate to one another.
Spatial Autocorrelation
Use Moran's I to find spatially organized metabolites and LISA to pinpoint the exact locations of significant "hotspots" and "coldspots".
Leiden Clustering
Perform unsupervised spatial segmentation to discover hidden metabolic regions within your tissue without prior anatomical knowledge.
Correlation Analysis
Reveal systemic metabolic relationships and identify potential biological pathways by finding co-correlated metabolites.
Enrichment Analysis
Connect your molecular data to biological function by identifying which pathways are over-represented in your list of key metabolites.
And More...
MetaboNexus is constantly evolving with new features and analyses driven by community feedback.