Spatial Autocorrelation
Moran's I & LISA: Finding Structured Patterns
Moran's I: Global Spatial Clustering
Moran's I is a fundamental spatial statistic that answers the first and most critical question in any spatial study: "Is the distribution of this metabolite random, or is it spatially structured?"
What It Does
It calculates a single score (the Moran's I statistic) for each metabolite across an entire tissue sample. This score ranges from -1 (perfectly dispersed) through 0 (perfectly random) to +1 (perfectly clustered). A high, statistically significant Moran's I score indicates that the metabolite's concentration is not random and that it forms patterns, justifying further, more detailed spatial analysis.
What You Get
A ranked list of all metabolites, sorted by their Moran's I score and p-value. This allows you to immediately identify and prioritize the most spatially organized molecules in your dataset for deeper investigation.
Example: Ranked Metabolites
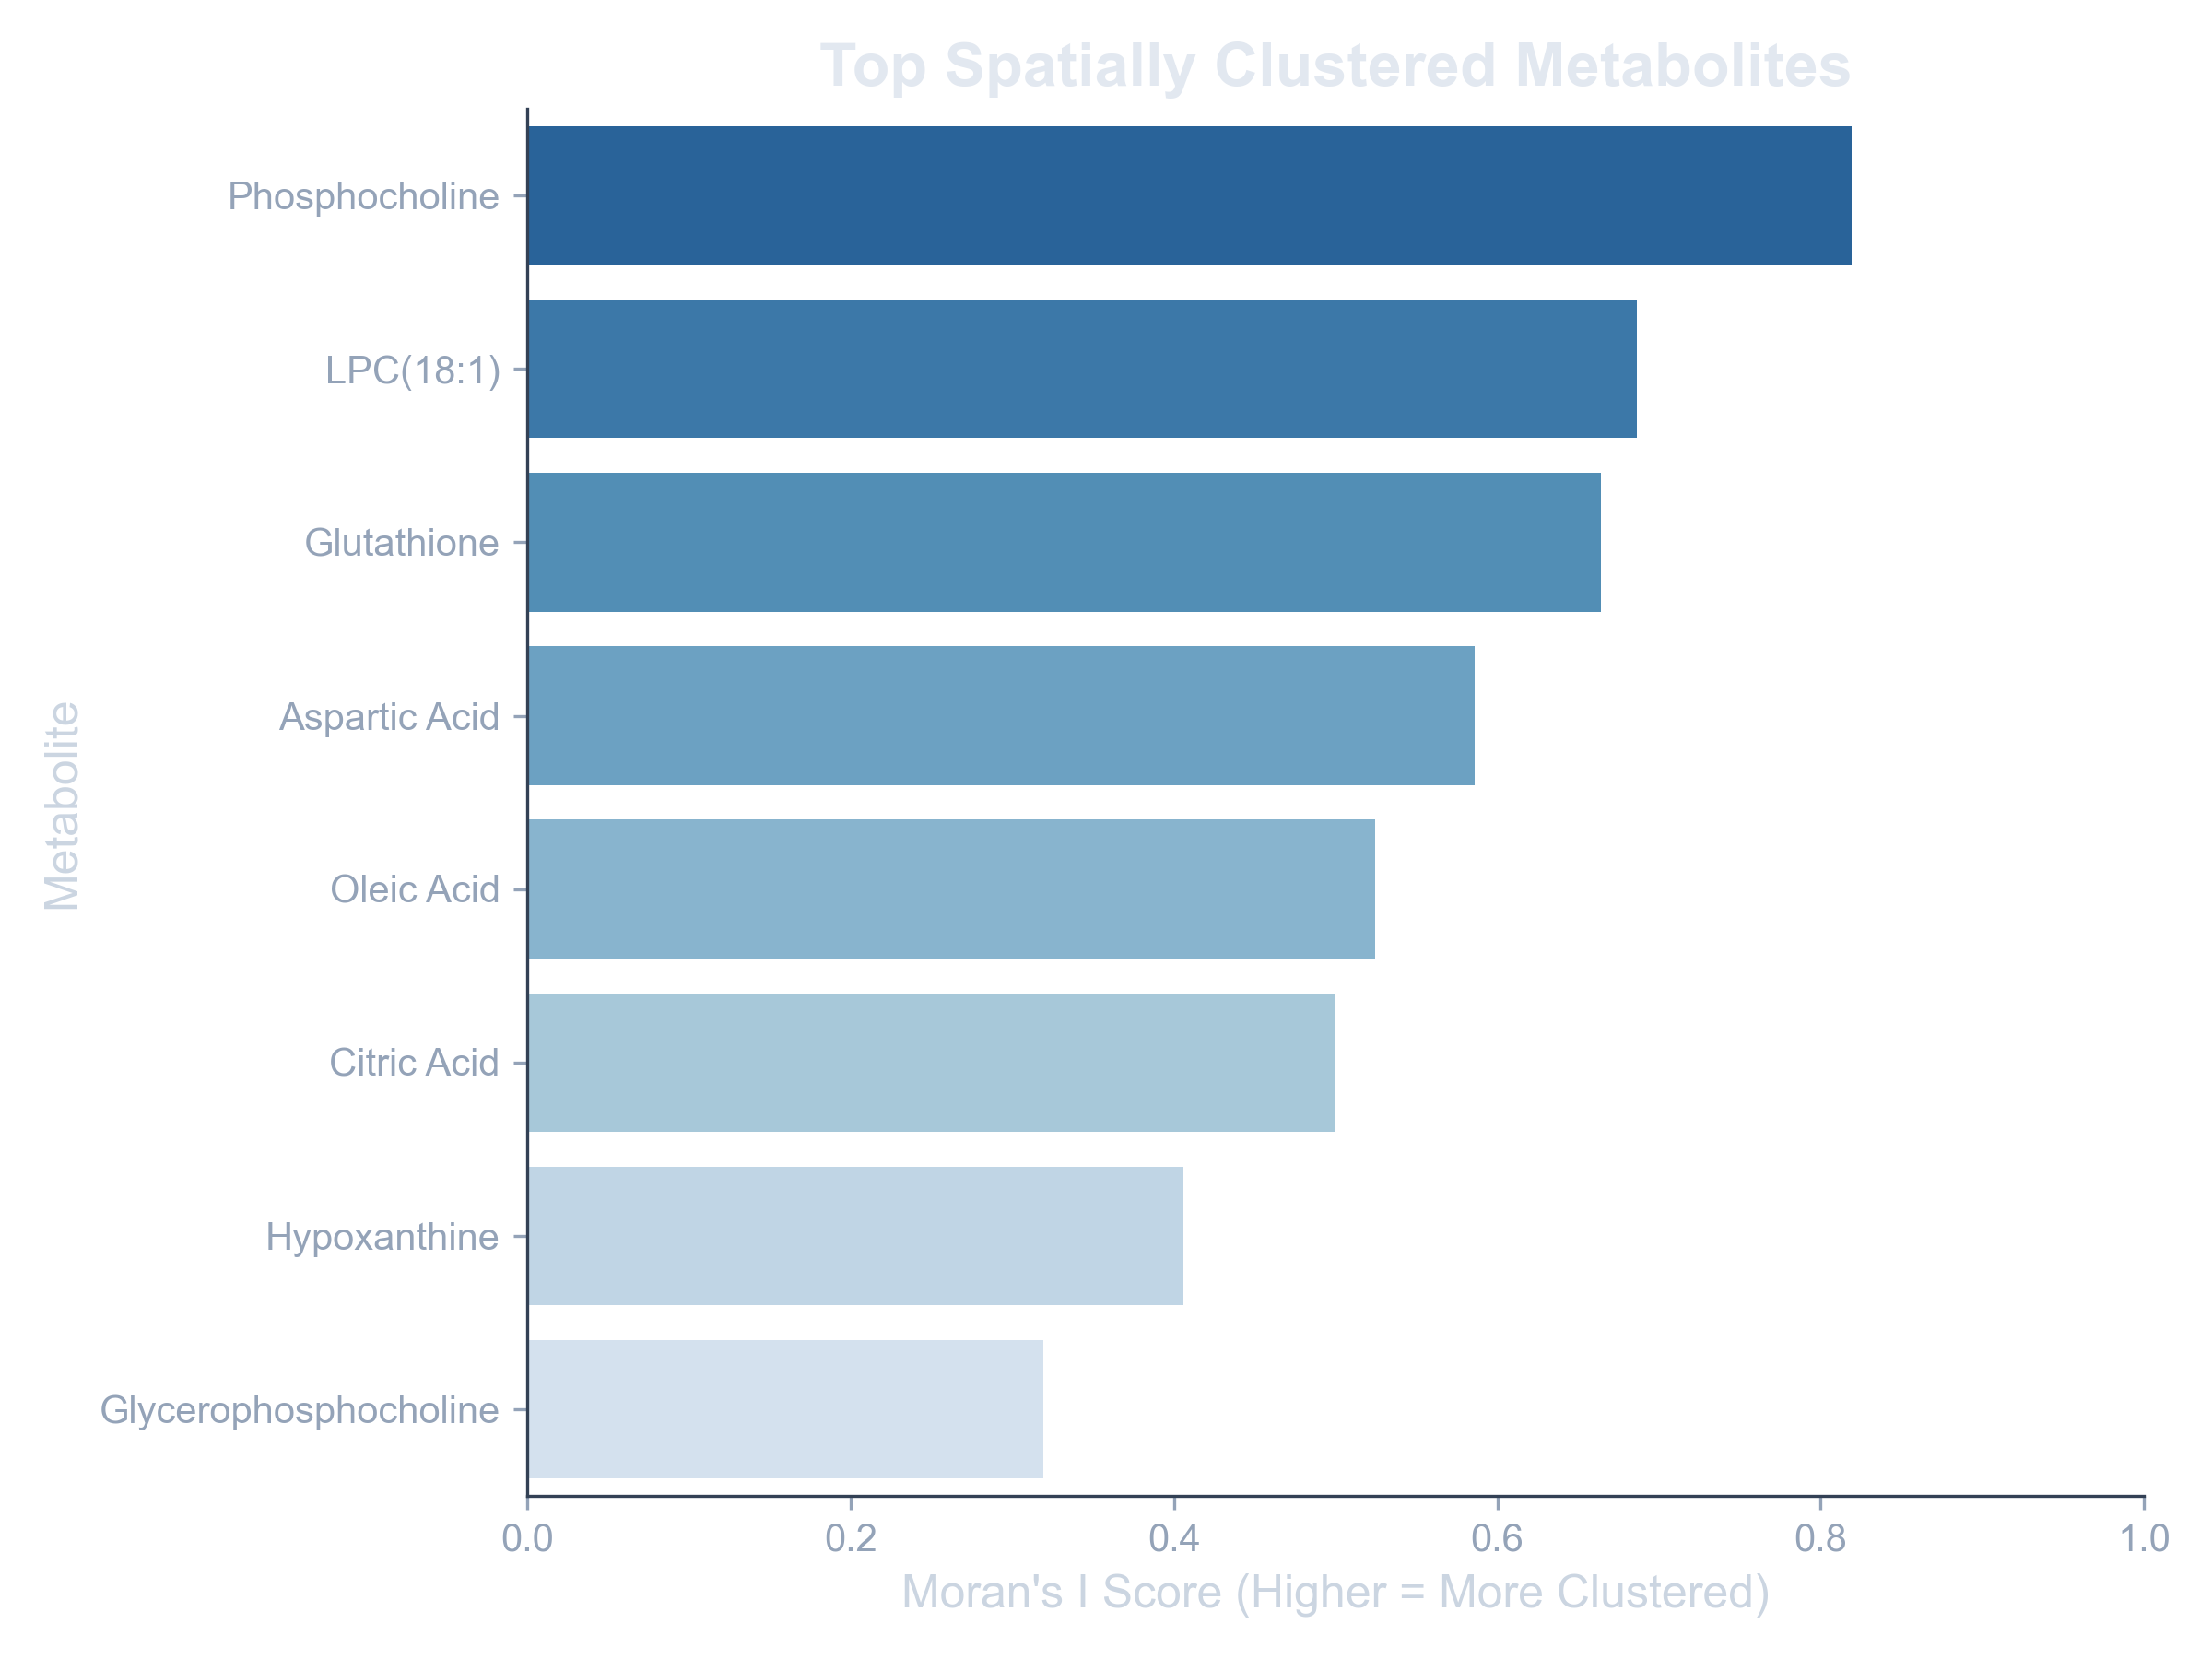
A table showing metabolites with the highest Moran's I scores, indicating strong spatial clustering.
LISA: Local Indicators of Spatial Association
While Moran's I gives a global score for the whole tissue, LISA (Local Indicators of Spatial Association) provides a local, spot-by-spot perspective.
Why It's Here: Finding the "Where"
Once you know a metabolite is spatially organized (from Moran's I), LISA tells you where and how. It is essential for identifying:
- Hotspots (High-High clusters): Regions where a spot with high abundance is surrounded by other spots with high abundance.
- Coldspots (Low-Low clusters): Regions where low-abundance spots are surrounded by other low-abundance spots.
- Spatial Outliers: Individual spots that are significantly different from their immediate neighbors (e.g., a high-abundance spot surrounded by low-abundance spots).
What You Get
You get spatial maps showing the precise locations of these hotspots and coldspots for each metabolite. MetaboNexus also generates aggregated "consensus" maps showing regions where many different metabolites are all highly abundant, often revealing key biological microenvironments.
Example: LISA Hotspot Map

A LISA map clearly identifying a statistically significant "hotspot" (red) for a key metabolite.