Correlation Analysis
Understanding Systemic Metabolic Relationships
What It Does
[cite_start]This module performs a non-spatial analysis, calculating the pairwise correlation (e.g., Pearson, Spearman) for every metabolite against every other metabolite across all spots in your dataset. [cite: 77] It essentially asks: "When the level of metabolite A goes up, what happens to the level of metabolite B?"
Why It's Here: Inferring Biological Connections
[cite_start]This analysis is fundamental to understanding systemic metabolic relationships. [cite: 78] While correlation does not equal causation, strong correlations are powerful indicators of a biological connection. [cite_start]Metabolites that are highly correlated (either positively or negatively) may be: [cite: 79]
-
[cite_start]
- Part of the same biological pathway (e.g., a precursor and its product). [cite: 79] [cite_start]
- Regulated by the same master transcription factor or signaling cascade. [cite: 79] [cite_start]
- Co-localized within the same organelle or cell type. [cite: 79]
What You Get: Visualizing Metabolic Modules
[cite_start]The module produces a full correlation matrix (saved as a CSV file for your records) and, more importantly, a visually intuitive heatmap or clustermap. [cite: 80] [cite_start]The clustermap is particularly powerful, as it uses hierarchical clustering to automatically group co-correlated metabolites together. [cite: 81] [cite_start]This allows you to easily spot large "blocks" of correlated molecules, which often represent coregulated metabolic modules that are active in your sample. [cite: 81]
Example: Clustered Heatmap
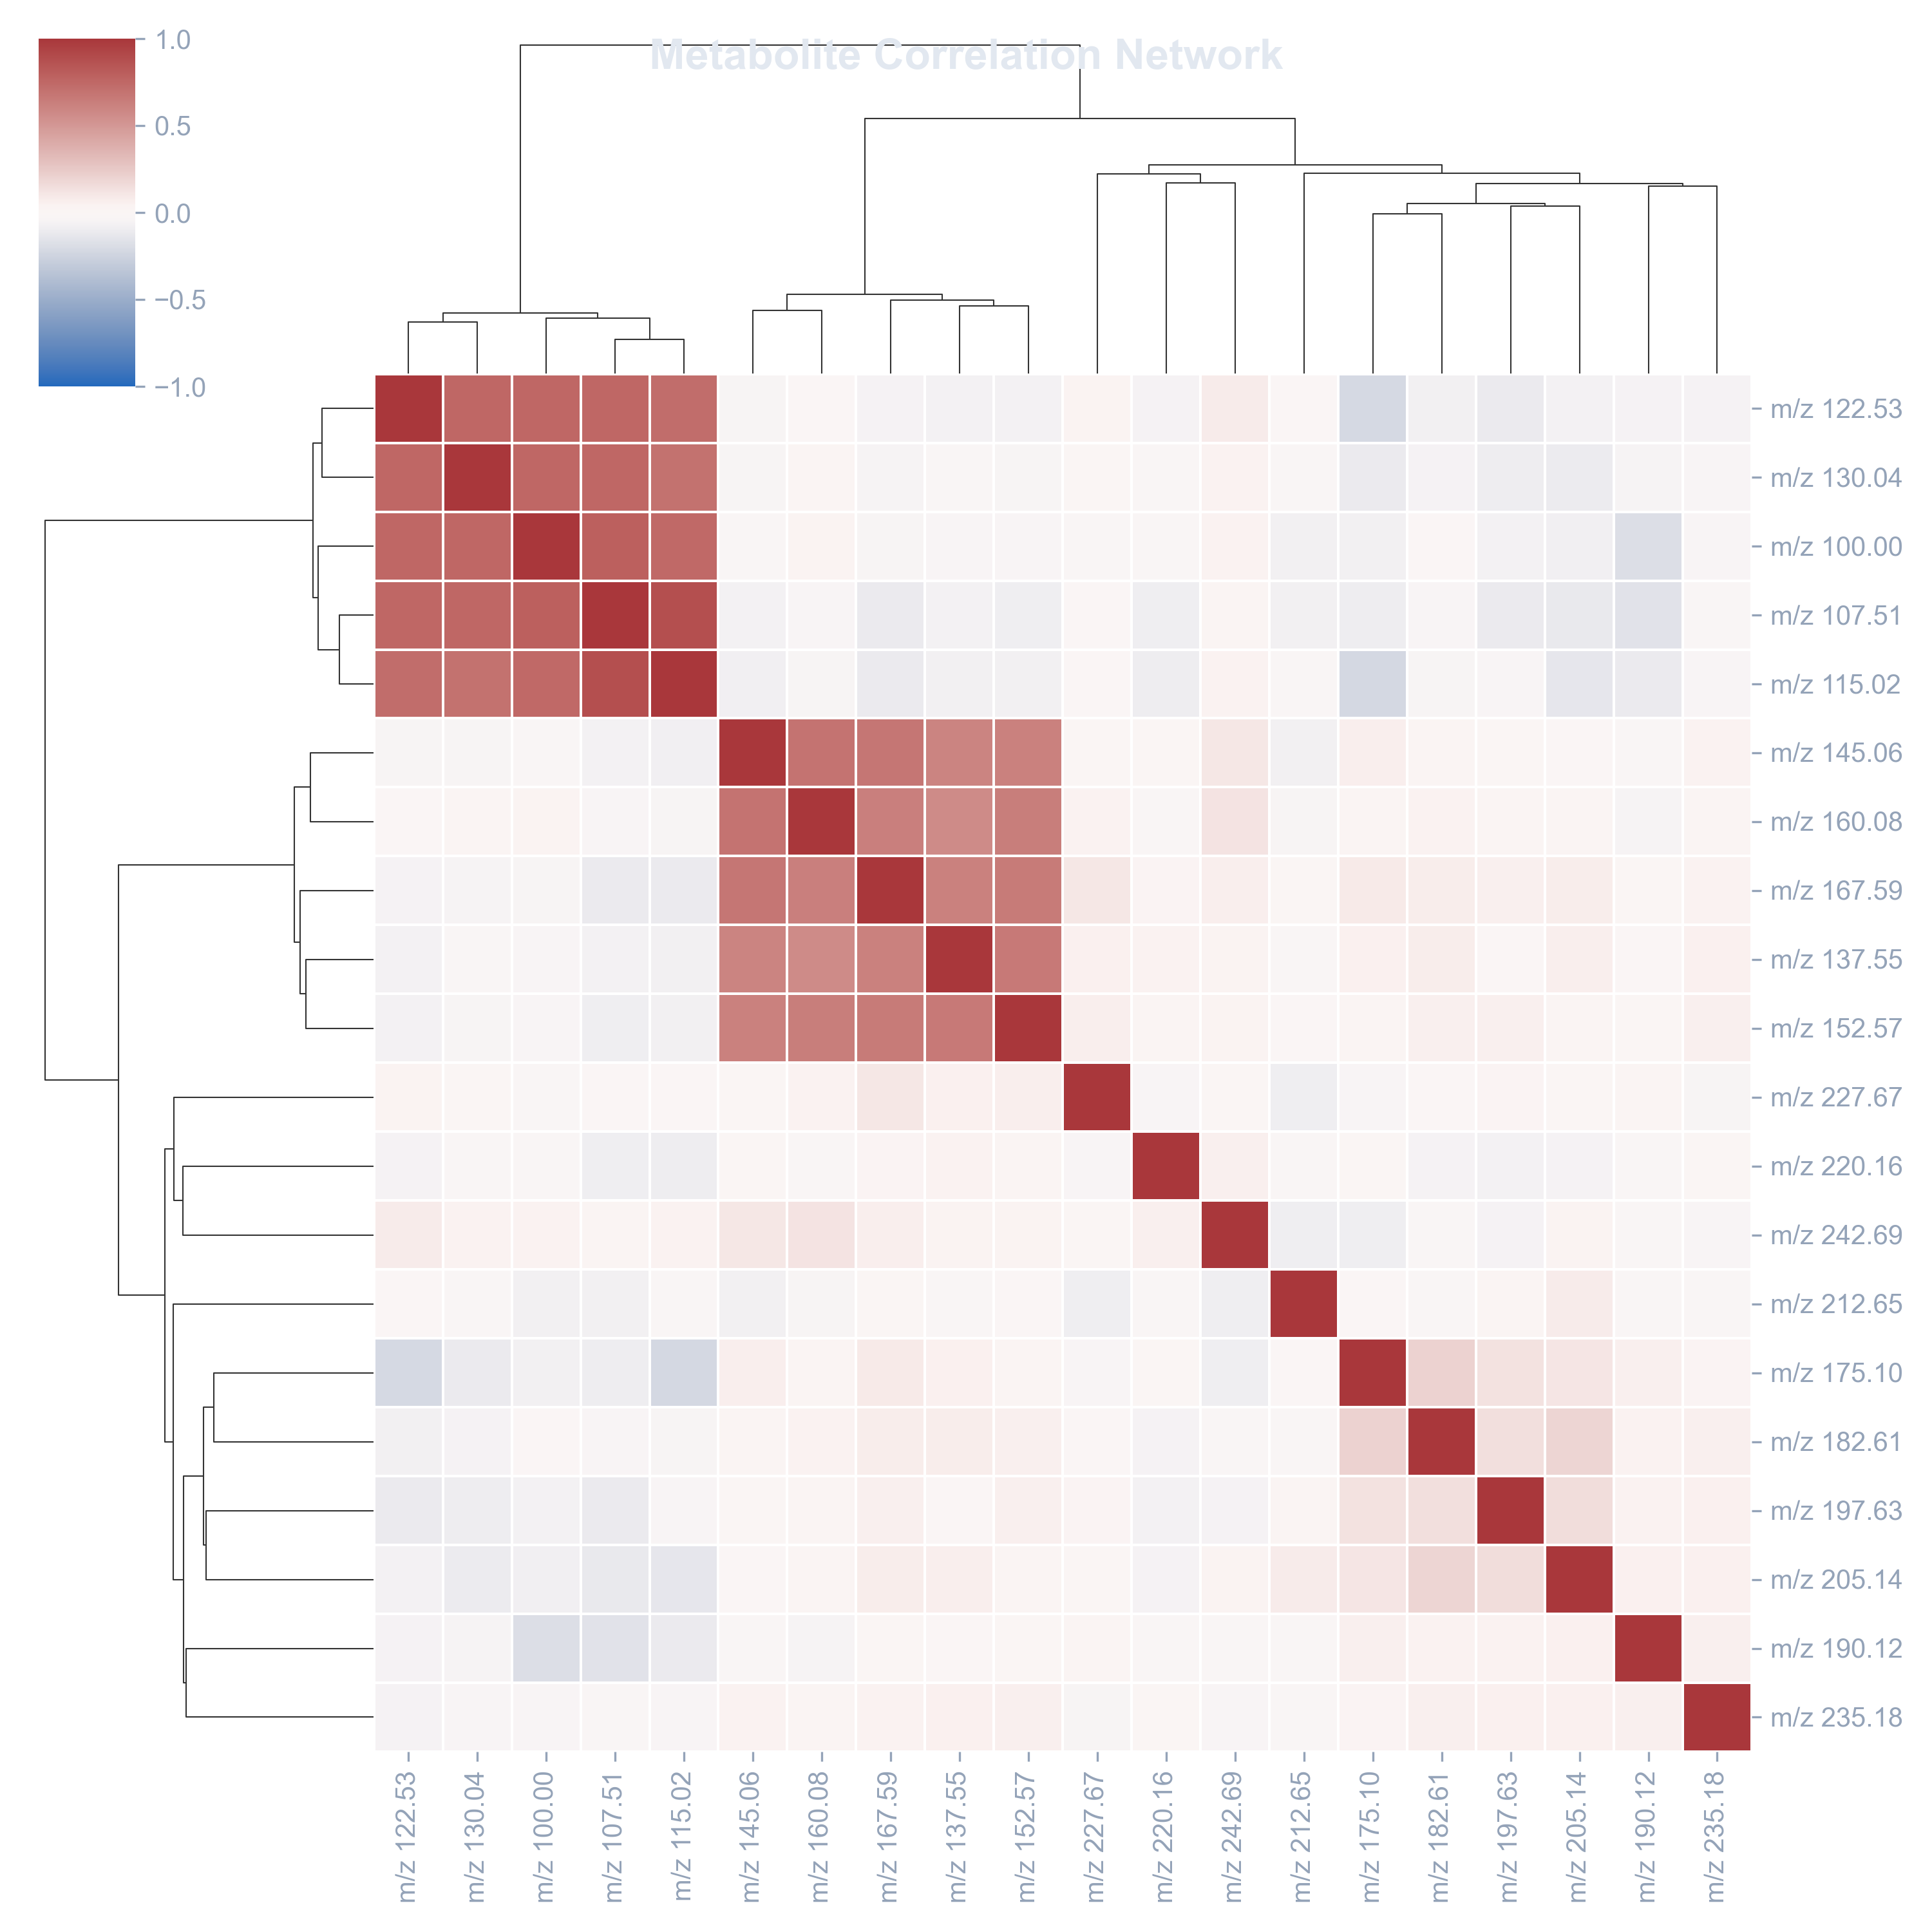
A clustermap showing blocks of highly correlated metabolites (red squares), which represent potential biological modules.