Pathway Enrichment Analysis
Connecting Molecular Observations to Biological Function
What It Does
This powerful analysis provides crucial biological context to your findings. You provide it with a list of interesting metabolites (e.g., those with a high Moran's I score, or those that are statistically different between two groups). The algorithm then performs a hypergeometric test against a local database (combining Reactome, RankDB, and WikiPathways) to see if your molecules are statistically over-represented in any known biological pathways.
Why It's Here: From "What" to "Why"
Enrichment analysis bridges the gap between your molecular observations and their functional meaning. It elevates your research from a list of molecules to a biological story. For example:
- Finding that 20 different lipids are upregulated in a tumor is interesting.
- Finding that those 20 lipids are all key players in the "Glycerophospholipid Metabolism" pathway is a significant biological insight.
What You Get: Actionable Biological Insights
The output is a ranked list or bar chart of biological pathways that are "enriched" in your list of metabolites, along with their statistical significance (p-value). This allows you to confidently report that the metabolic changes you've observed are not random, but are concentrated in specific, functionally relevant processes, providing a strong foundation for your next hypothesis.
Example: Enriched Pathways Plot
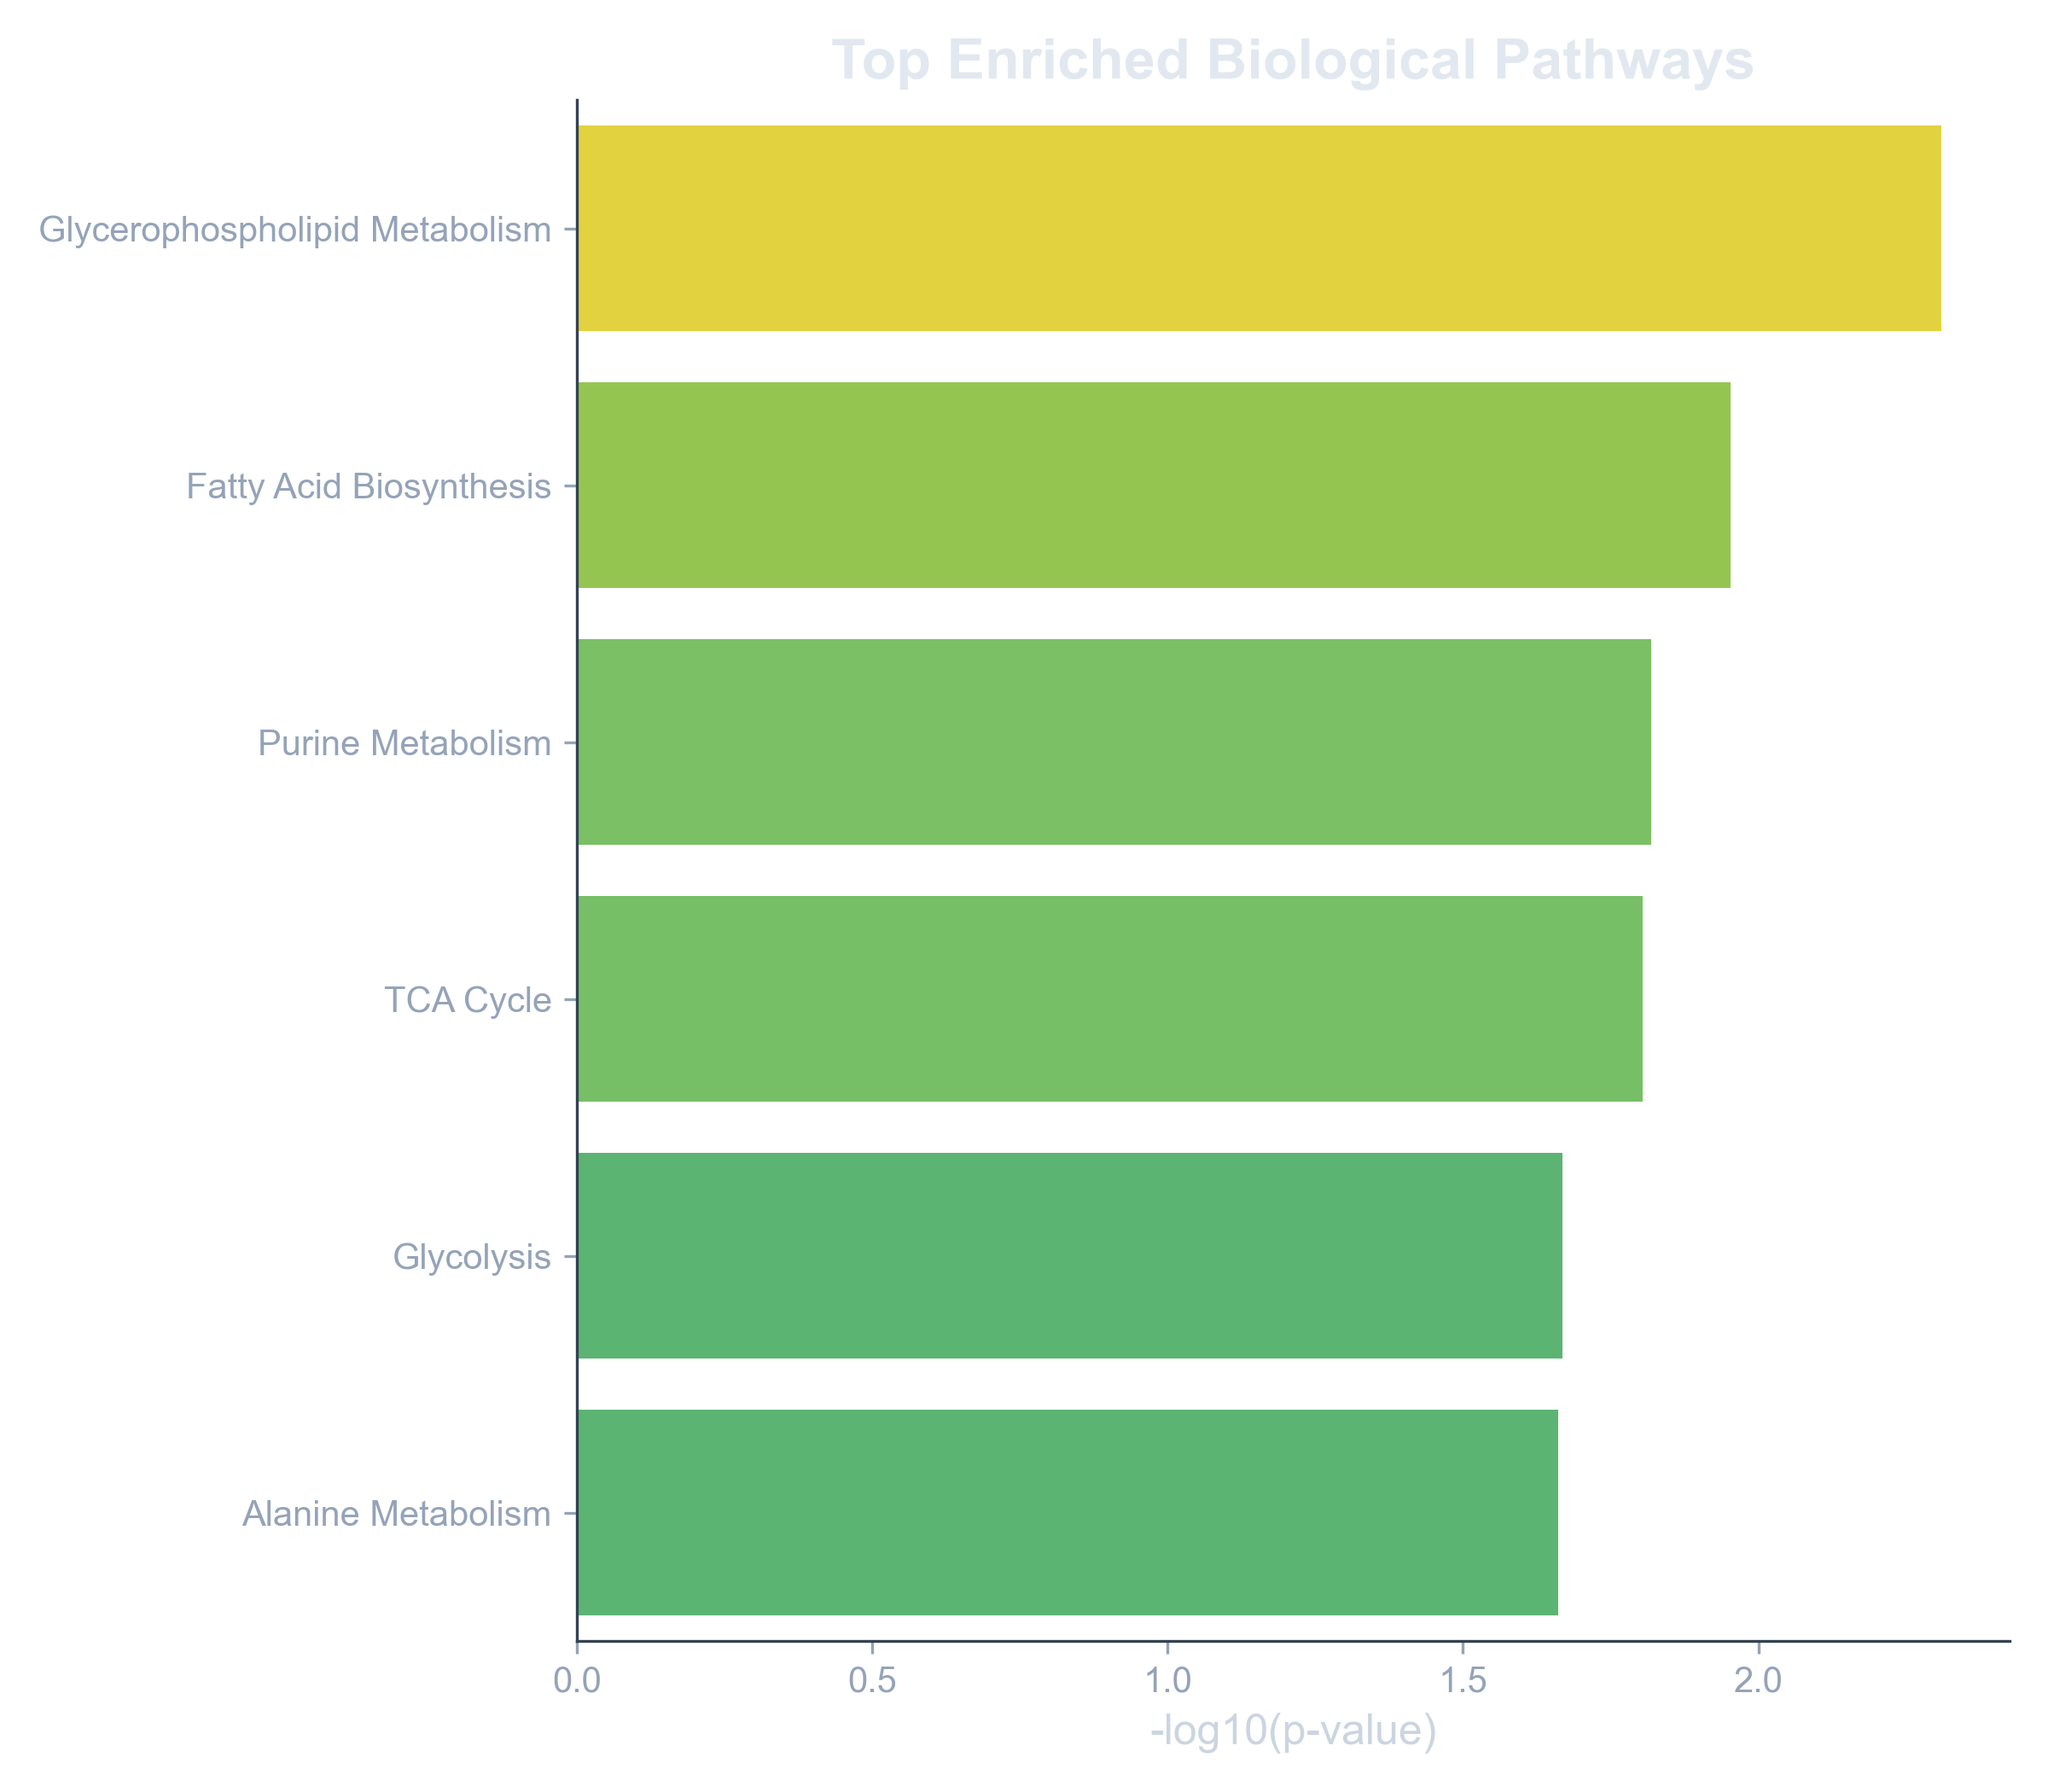
A bar plot showing the top pathways enriched in a list of significant metabolites, pointing towards a dysregulation in lipid metabolism.